
How Machine Learning Can Identify Abnormal Industrial Water Consumption
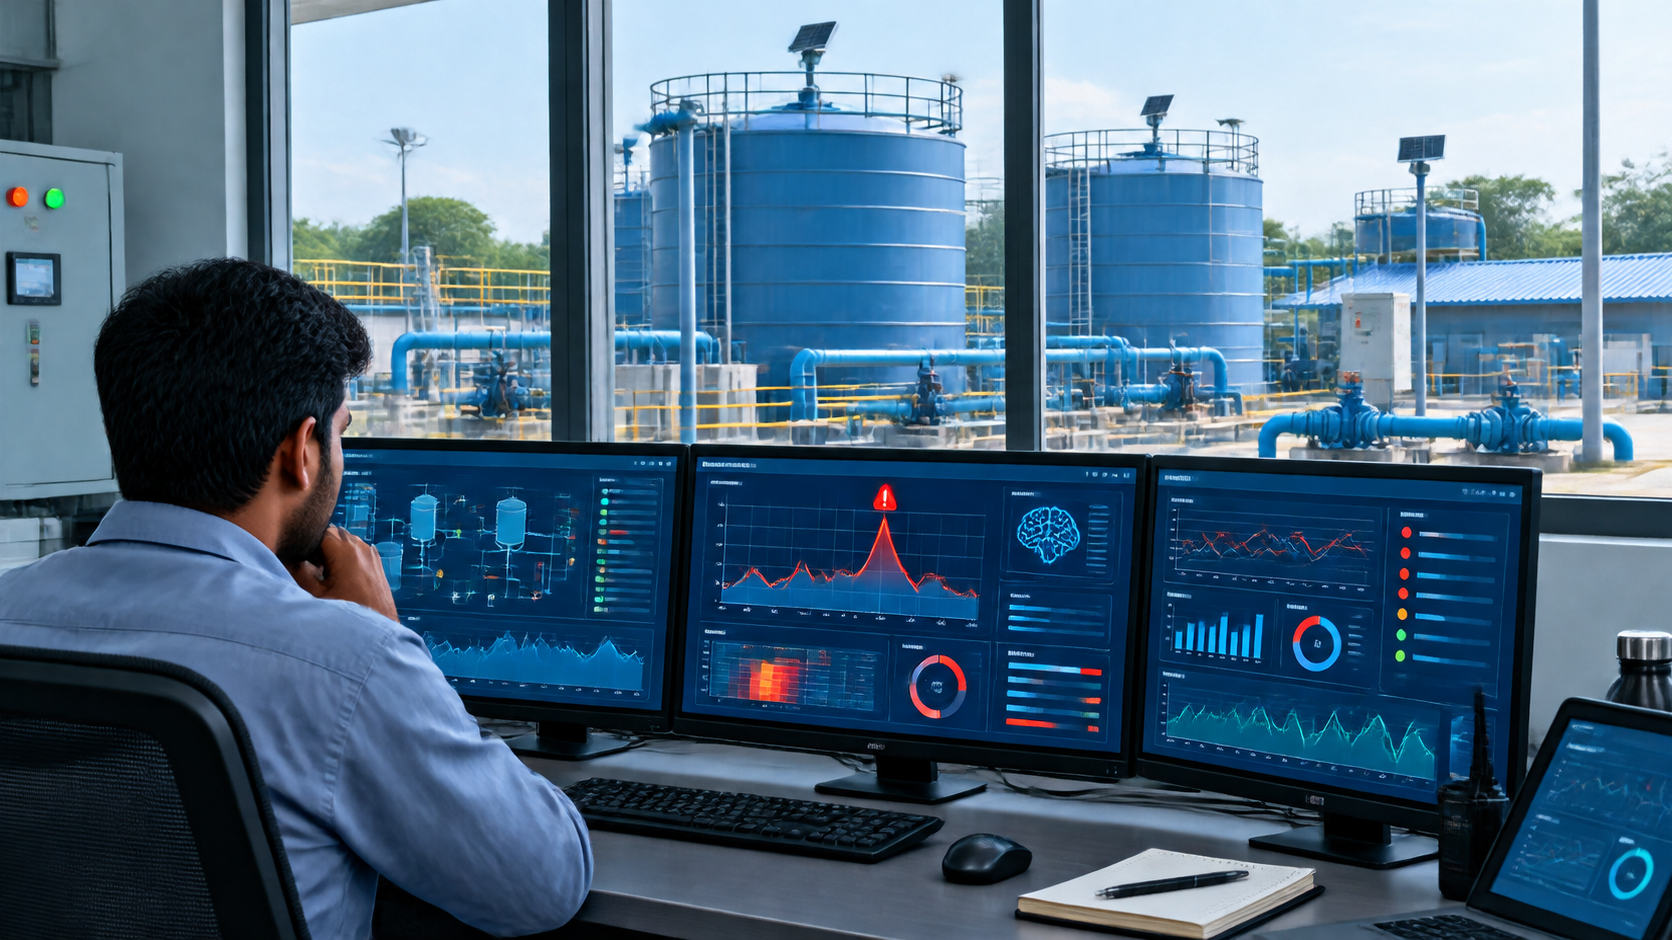
Industrial facilities use water for manufacturing, cooling, cleaning, processing, utilities, and other operations. Because water consumption can vary according to production schedules and operating conditions, identifying abnormal usage can be challenging when facilities rely only on manual readings.
Machine learning can analyze historical water-consumption data and identify patterns that differ from normal operating behavior. When combined with IoT sensors, flow meters, tank-level monitoring, and cloud platforms, machine learning can support more data-driven industrial water management.
For organizations exploring industrial water monitoring Tamil Nadu, combining machine learning with Industrial Tank Monitoring can provide additional visibility into water storage and consumption patterns.
What Is Machine Learning in Water Monitoring?
Machine learning is a data-analysis approach that allows software to identify patterns in historical data and detect deviations from those patterns.
In an industrial water-monitoring system, machine learning can analyze data such as:
-
Tank-level readings
-
Flow measurements
-
Water consumption
-
Pump operating times
-
Production schedules
-
Historical usage
-
Time and date
-
Sensor status
The system can learn what typical water consumption looks like under different operating conditions.
When new data differs significantly from established patterns, it can be flagged for investigation.
Why Abnormal Industrial Water Consumption Is Difficult to Identify
Industrial water consumption is rarely constant.
A factory may use more water during:
-
High-production periods
-
Cleaning operations
-
Equipment maintenance
-
Specific production processes
-
Certain shifts
Therefore, a simple rule such as "high consumption equals abnormal consumption" may not be accurate.
Machine learning can consider historical patterns and operating conditions to distinguish normal variation from potentially unusual behavior.
How Machine Learning Detects Anomalies
A simplified process looks like this:
Sensor Data → Historical Analysis → Normal Pattern → New Data → Pattern Comparison → Anomaly Flag
For example, suppose a manufacturing facility normally consumes a certain amount of water during a particular production shift.
If the system detects substantially different consumption without a corresponding operational explanation, it can flag the event.
The alert does not automatically prove that water is being wasted. It indicates that the facility team may want to investigate the change.
Role of Industrial Tank Monitoring
Industrial Tank Monitoring provides important data for machine-learning models.
Tank-level sensors can record how water levels change over time.
For example:
Water Added to Tank → Tank Level Increases → Production Uses Water → Tank Level Decreases
By recording these changes continuously, the system can build a historical picture of water movement.
Machine learning can then analyze this historical information to identify unusual tank-level patterns.
Combining Tank-Level and Flow Data
Tank-level data becomes more useful when combined with flow measurements.
For example:
Water Inlet → Flow Meter → Storage Tank → Level Sensor → Production Area → Flow Meter
This allows the monitoring system to compare water entering, being stored, and being consumed.
If the measured values do not align with expected operating patterns, the system can flag the difference for investigation.
The exact interpretation depends on the facility's water network and sensor configuration.
MyTank and Industrial Water Monitoring
MyTank is an IoT-based water monitoring platform that can connect water-level sensors and other water-management equipment to a cloud-based monitoring environment.
For industrial applications, connected Industrial Tank Monitoring can provide data about water storage and tank-level changes.
Depending on the deployment, MyTank can support functions such as:
-
Remote tank-level monitoring
-
Historical data
-
Alerts
-
Multi-tank monitoring
-
Pump automation integration
-
Cloud-based visualization
This type of connected infrastructure can provide the data foundation required for advanced analytics.
Identifying Unexpected Tank-Level Drops
One potential application of machine learning is identifying unusual tank-level declines.
For example:
Normal Production → Predictable Tank-Level Decline
compared with:
Similar Production → Significantly Larger Tank-Level Decline → Anomaly Flag
The system can identify the difference based on historical data.
Possible causes may include:
-
Increased water consumption
-
Leakage
-
Cleaning activities
-
Process changes
-
Valve operation
-
Sensor errors
The facility team would need to investigate the cause.
Detecting Water Use During Inactive Periods
Machine learning can also analyze water consumption during periods when industrial activity is normally low.
For example, a facility may typically have minimal water consumption overnight.
If the monitoring system detects an unusual level of consumption during this period, it can flag the event.
Potential explanations could include:
-
Maintenance activities
-
Cleaning
-
Cooling systems
-
Unplanned operations
-
Leakage
Again, the anomaly is an indicator for investigation rather than automatic proof of a particular cause.
Learning Different Production Patterns
One advantage of machine learning is that it can analyze different operating conditions.
A factory may have different water-consumption patterns for:
-
Weekdays
-
Weekends
-
Day shifts
-
Night shifts
-
High-production periods
-
Low-production periods
-
Maintenance periods
Instead of treating every measurement identically, analytics can consider historical context.
This can make anomaly detection more useful for complex industrial environments.
Detecting Gradual Changes
Not every water-use problem appears as a sudden spike.
A gradual increase in consumption may also be important.
For example:
Month 1 → Normal Consumption
Month 2 → Slight Increase
Month 3 → Further Increase
Month 4 → Significant Increase
Machine-learning analytics can identify trends that may be difficult to notice through occasional manual readings.
Facility teams can then investigate whether the change is related to production, equipment performance, leakage, or another operational factor.
Machine Learning and Pump Monitoring
Pump operation can provide additional information for anomaly detection.
A monitoring system can track:
-
Pump start frequency
-
Pump runtime
-
Tank-level changes
-
Water flow
-
Filling cycles
If a pump begins operating significantly more frequently than usual, the system can flag the change.
Potential causes could include increased demand, leakage, changes in tank-level thresholds, or equipment issues.
How Alerts Can Support Maintenance Teams
Once an anomaly is detected, the monitoring platform can generate an alert.
A typical workflow is:
Data Collection → Machine Learning Analysis → Abnormal Pattern Detected → Alert → Maintenance Investigation
The maintenance team can then examine the relevant tank, pipeline, pump, valve, or production process.
This can help direct attention toward areas where the data indicates a potential issue.
Applications for Tamil Nadu Industries
Machine-learning-based water monitoring can be relevant to different industrial sectors across Tamil Nadu.
Textile Industries
Water consumption can vary according to production and processing activities. Monitoring can help identify unusual changes in usage.
Automotive Manufacturing
Water may be used for cooling, cleaning, manufacturing processes, and utilities.
Food Processing
Production and cleaning schedules can influence water demand.
Chemical Industries
Water consumption can vary across different processes and operating conditions.
Engineering and Manufacturing
Multiple tanks and production areas can create complex water-monitoring requirements.
Benefits of Machine Learning for Industrial Water Monitoring
For organizations implementing industrial water monitoring Tamil Nadu, machine learning can help:
-
Identify unusual consumption patterns
-
Analyze historical water data
-
Detect abnormal tank-level changes
-
Identify gradual consumption trends
-
Compare different operating periods
-
Support potential leak investigations
-
Prioritize maintenance inspections
-
Improve visibility across multiple tanks
The effectiveness depends on the quality and quantity of available sensor data.
What Data Is Needed?
Machine-learning systems require reliable data.
Useful inputs can include:
-
Tank-level measurements
-
Flow-meter readings
-
Pump status
-
Valve status
-
Production schedules
-
Historical consumption
-
Time-based information
The more representative and reliable the data, the more useful the resulting analysis can be.
Machine Learning Does Not Replace Human Investigation
An important limitation is that machine learning identifies patterns; it does not necessarily determine the physical reason for an abnormal reading.
For example, an unexpected increase in water consumption could be caused by:
-
A production increase
-
Cleaning
-
Maintenance
-
Leakage
-
Equipment operation
-
Sensor error
The system can identify the unusual pattern, while facility personnel investigate and verify the cause.
Conclusion
Machine learning can help industrial facilities analyze large volumes of water-consumption and tank-level data to identify patterns that differ from normal operating behavior.
When combined with Industrial Tank Monitoring, IoT sensors can provide the continuous data required to analyze tank-level changes, consumption patterns, pump activity, and other operational indicators.
Platforms such as MyTank can provide connected water-monitoring infrastructure that collects and visualizes tank-level information, creating a foundation for data-driven water management.
For organizations exploring industrial water monitoring Tamil Nadu, combining IoT monitoring with machine-learning analytics can help identify unusual water-consumption patterns and direct maintenance teams toward areas that may require further investigation.
- Digital Agency
- Literie
- Location de voitures
- Restaurant
- Restaurant
- Mode
- Mode
- Information
- Marketing
- Tourisme
- Développement
- Découverte
- Législation
- Gastronomie
- Pâtisserie
- Event
- Art
- Causes
- Crafts
- Dance
- Drinks
- Film
- Fitness
- Food
- Games
- Gardening
- Health
- Home
- Literature
- Music
- Networking
- Other
- Party
- Religion
- Shopping
- Sports
- Theater
- Wellness
 English
 Indian
 French
 Arabic
 Spanish
 Portuguese
 Deutsch
 Turkish
 Dutch
Dutch
 Italiano
 Russian
 Romaian
 Portuguese (Brazil)
 Greek
Greek