


Tableau vs Power BI: Which Tool Should You Learn?
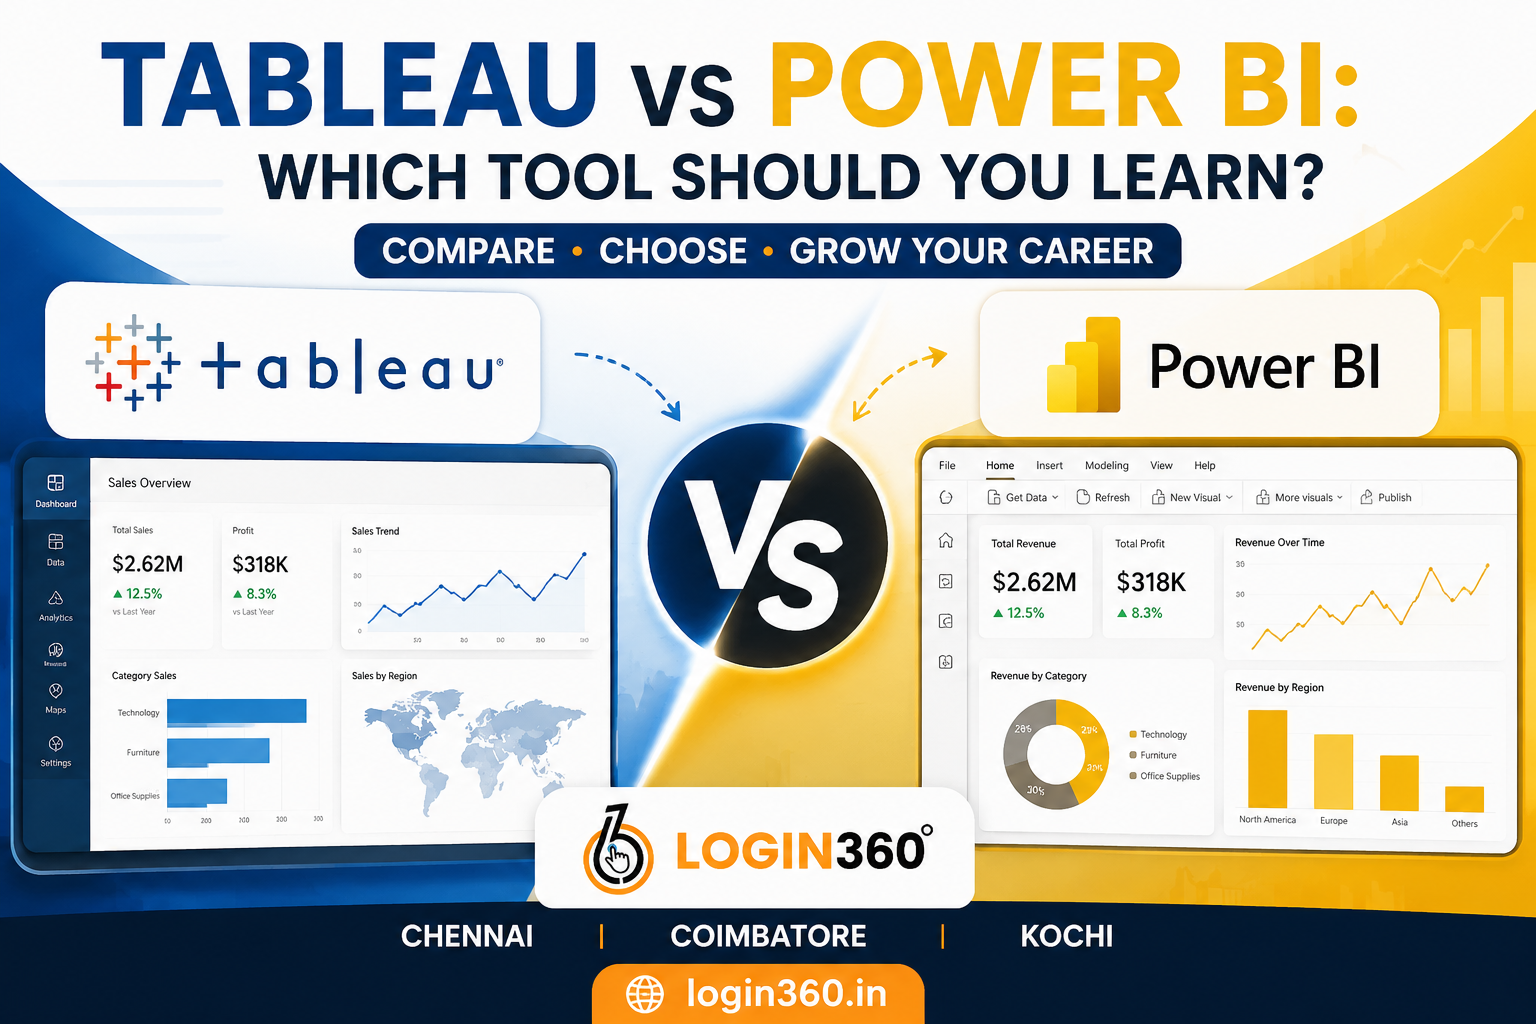
Introduction
Choosing between Tableau and Power BI can be difficult if you're starting a career in data analytics or business intelligence. Both tools help businesses turn raw data into meaningful insights through interactive dashboards and reports. They are trusted by companies across industries, but each has its own strengths. This guide compares Tableau and Power BI to help you understand their differences and decide which tool matches your career goals.
Understanding Tableau
Tableau is a powerful business intelligence tool designed for creating advanced visualizations and interactive dashboards. It allows users to connect to different data sources, explore large datasets, and present information in an easy to understand format. Many multinational companies prefer Tableau because of its strong analytics capabilities and professional level reporting.
Benefits of Tableau
- Advanced and interactive data visualizations.
- Connects with multiple databases and cloud platforms.
- Excellent performance with large datasets.
- Strong analytical and forecasting features.
- Ideal for complex business reporting.
Understanding Power BI
Power BI is Microsoft's business analytics platform that helps users collect, analyze, and visualize business data. It is known for its simple interface and easy integration with Microsoft products such as Excel, Azure, and SharePoint. Because of its affordability and user friendly design, Power BI is one of the most popular tools for beginners and businesses of all sizes.
Benefits of Power BI
- Easy to learn and use.
- Affordable licensing plans.
- Seamless integration with Microsoft applications.
- Cloud-based collaboration and report sharing.
- AI-powered insights and automated analytics.
Tableau vs Power BI: Major Differences
| Feature | Tableau | Power BI |
|---|---|---|
| User Interface | Advanced | Beginner-friendly |
| Visualization | Highly customizable | Easy and effective |
| Pricing | Premium | Cost-effective |
| Speed | Excellent with large data | Fast for medium-sized data |
| Integration | Supports many platforms | Best with Microsoft ecosystem |
| Learning Curve | Moderate | Easy |
| Best Users | Data Analysts and Enterprises | Students, Beginners, Businesses |
Which Tool Offers Better Data Visualization?
When it comes to visual storytelling, Tableau is often considered the leader. It provides more customization options, allowing users to create unique and visually appealing dashboards. Businesses that rely on detailed data analysis often choose Tableau for this reason.
Power BI also delivers high quality visualizations but focuses more on simplicity and business reporting. It offers enough customization for most organizations while keeping the interface easy to understand.
Ease of Learning for Beginners
Power BI is generally the better option for beginners. Its interface is similar to Microsoft Excel, making it easier for new users to learn quickly. Tableau requires a little more practice because it offers more advanced features, but learning it can be highly rewarding for professionals who want to specialize in data visualization.
Cost Comparison
Budget is an important factor when choosing a business intelligence tool. Power BI offers affordable pricing, making it accessible for students, freelancers, and small businesses. Tableau provides premium features but comes with a higher subscription cost, making it more suitable for medium and large enterprises.
Job Opportunities
Both Tableau and Power BI skills are in high demand. Companies in banking, healthcare, retail, IT, manufacturing, and e-commerce regularly hire professionals with expertise in these tools. While Power BI has a larger presence in organizations using Microsoft technologies, Tableau remains a preferred choice for businesses that require advanced data analytics and detailed dashboard development.
Should You Learn Tableau or Power BI First?
If you're completely new to business intelligence, starting with Power BI is often the smartest choice because of its simple interface and lower cost. Once you're comfortable with data visualization concepts, learning Tableau can help you build advanced analytical skills and qualify for more specialized roles. Professionals who know both tools often have better career opportunities and higher earning potential.
Conclusion
Tableau and Power BI are both excellent business intelligence tools that help organizations make better decisions through data analysis. Power BI is perfect for beginners because it is affordable, easy to learn, and integrates well with Microsoft products. Tableau is ideal for professionals who want advanced visualization and enterprise level analytics. Learning either tool is valuable, but mastering both can give you a competitive advantage in today's growing data analytics industry.
- Digital Agency
- Literie
- Location de voitures
- Restaurant
- Restaurant
- Mode
- Mode
- Information
- Marketing
- Tourisme
- Développement
- Découverte
- Législation
- Gastronomie
- Pâtisserie
- Etkinlik
- Art
- Causes
- Crafts
- Dance
- Drinks
- Film
- Fitness
- Food
- Oyunlar
- Gardening
- Health
- Ana sayfa
- Literature
- Music
- Networking
- diğer
- Party
- Religion
- Shopping
- Sports
- Theater
- Wellness
 Turkish
 Indian
 English
 French
 Arabic
 Spanish
 Portuguese
 Deutsch
 Dutch
Dutch
 Italiano
 Russian
 Romaian
 Portuguese (Brazil)
 Greek
Greek