


Introduction to Microsoft Excel for Data Analytics
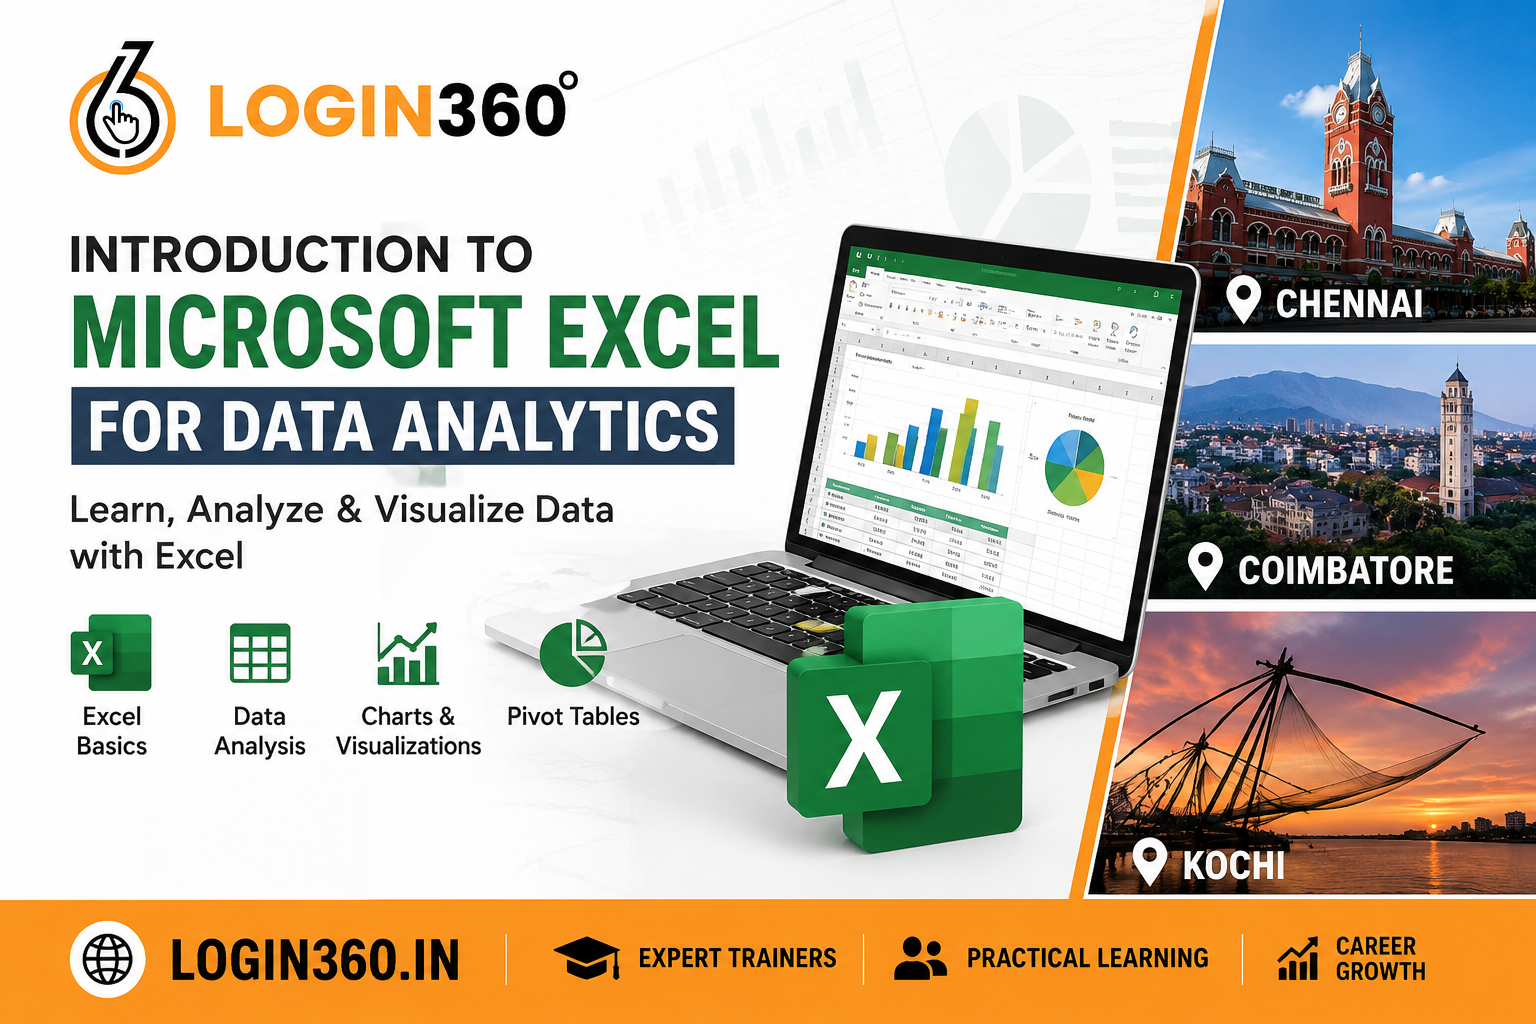
Introduction
Microsoft Excel has become one of the most trusted tools for data analytics, helping individuals and businesses turn raw information into meaningful insights. From small businesses to multinational companies, Excel is widely used to organize data, perform calculations, identify trends, and create professional reports. Its simple interface and powerful analytical features make it an excellent choice for beginners as well as experienced professionals.
If you're planning to start a career in data analytics or simply want to improve your data management skills, learning Microsoft Excel is the perfect first step. It provides practical tools that make working with data faster, easier, and more accurate.
Understanding Microsoft Excel in Data Analytics
Data analytics involves collecting, organizing, analyzing, and interpreting data to support better decision-making. Microsoft Excel simplifies this process by providing built-in tools that allow users to clean data, perform calculations, generate reports, and visualize results.
Unlike many advanced analytics platforms, Excel requires no coding knowledge, making it accessible to students, office employees, entrepreneurs, and business analysts.
Why Microsoft Excel is Popular for Data Analytics
Excel remains a preferred analytics tool because it combines flexibility with ease of use. Organizations across industries continue to rely on Excel for daily reporting and business analysis.
Some major advantages include:
- Easy data organization using worksheets and tables
- Fast calculations with built-in formulas
- Interactive charts and dashboards
- Data validation and error checking
- Powerful Pivot Tables for summarizing large datasets
- Integration with Microsoft Office applications
These features help users work more efficiently while improving the accuracy of their analysis.
Key Excel Skills Every Data Analyst Should Learn
Data Cleaning
Before analyzing information, datasets often need to be cleaned. Excel provides tools to remove duplicate records, correct formatting issues, split text into columns, and handle missing values. Clean data ensures reliable results and better decision-making.
Mathematical and Logical Functions
Excel offers hundreds of functions that simplify calculations. Some of the most commonly used functions include:
- SUM
- COUNT
- AVERAGE
- IF
- MAX
- MIN
- ROUND
Learning these formulas helps automate repetitive calculations and saves valuable time.
Lookup Functions
Finding specific information within large datasets is simple using lookup functions. Features such as VLOOKUP, XLOOKUP, and INDEX-MATCH allow users to retrieve data quickly without manually searching through spreadsheets.
These functions are widely used in finance, HR, sales, and inventory management.
Pivot Tables and Pivot Charts
Pivot Tables help summarize thousands of rows of data into easy-to-read reports. Users can compare sales by region, analyze monthly performance, or evaluate customer behavior with just a few clicks.
Adding Pivot Charts further improves data presentation, making reports more interactive and visually appealing.
Data Visualization
Visual representation makes complex data easier to understand. Excel offers various chart types, including:
- Column Charts
- Line Charts
- Pie Charts
- Area Charts
- Scatter Charts
These visuals help identify trends, patterns, and performance indicators at a glance.
Benefits of Learning Excel for Data Analytics
Learning Excel offers numerous career and business advantages.
Some important benefits include:
- Improves problem-solving skills
- Supports faster business reporting
- Increases workplace productivity
- Enhances decision-making using data
- Builds a strong foundation for advanced analytics tools like Power BI and SQL
- Creates better career opportunities in data-driven industries
Because Excel is widely used worldwide, mastering it can significantly improve your professional profile.
Industries That Use Excel for Data Analytics
Microsoft Excel is used in almost every industry where data plays an important role. Some common sectors include:
- Banking and Finance
- Healthcare
- Retail and E-commerce
- Manufacturing
- Marketing and Advertising
- Human Resources
- Education
- Logistics and Supply Chain
Professionals in these industries rely on Excel to monitor performance, prepare reports, forecast trends, and support business decisions.
Best Practices for Excel Data Analysis
To get the best results while working with Excel:
- Keep your data organized using tables.
- Use meaningful column headings.
- Avoid unnecessary blank rows and columns.
- Verify formulas before creating reports.
- Apply filters to focus on relevant information.
- Save backup copies of important datasets.
- Use charts only when they improve understanding.
Following these practices ensures accurate analysis and professional-looking reports.
Conclusion
Microsoft Excel continues to be one of the most valuable tools for data analytics because of its simplicity, flexibility, and powerful analytical capabilities. Whether you are analyzing business performance, managing financial records, or creating interactive dashboards, Excel provides everything needed to transform raw data into meaningful insights.
By mastering Excel's formulas, data visualization tools, Pivot Tables, and reporting features, you can improve your analytical skills and make smarter, data-driven decisions. For anyone beginning a journey in data analytics, Microsoft Excel remains an essential skill that delivers long-term career and business benefits.
- Digital Agency
- Literie
- Location de voitures
- Restaurant
- Restaurant
- Mode
- Mode
- Information
- Marketing
- Tourisme
- Développement
- Découverte
- Législation
- Gastronomie
- Pâtisserie
- Event
- Art
- Causes
- Crafts
- Dance
- Drinks
- Film
- Fitness
- Food
- Games
- Gardening
- Health
- Home
- Literature
- Music
- Networking
- Other
- Party
- Religion
- Shopping
- Sports
- Theater
- Wellness
 English
 Indian
 French
 Arabic
 Spanish
 Portuguese
 Deutsch
 Turkish
 Dutch
Dutch
 Italiano
 Russian
 Romaian
 Portuguese (Brazil)
 Greek
Greek