


Why Financial Ratios Fail: Common Misinterpretations and How to Avoid Costly Errors
When the Tool Becomes the Problem
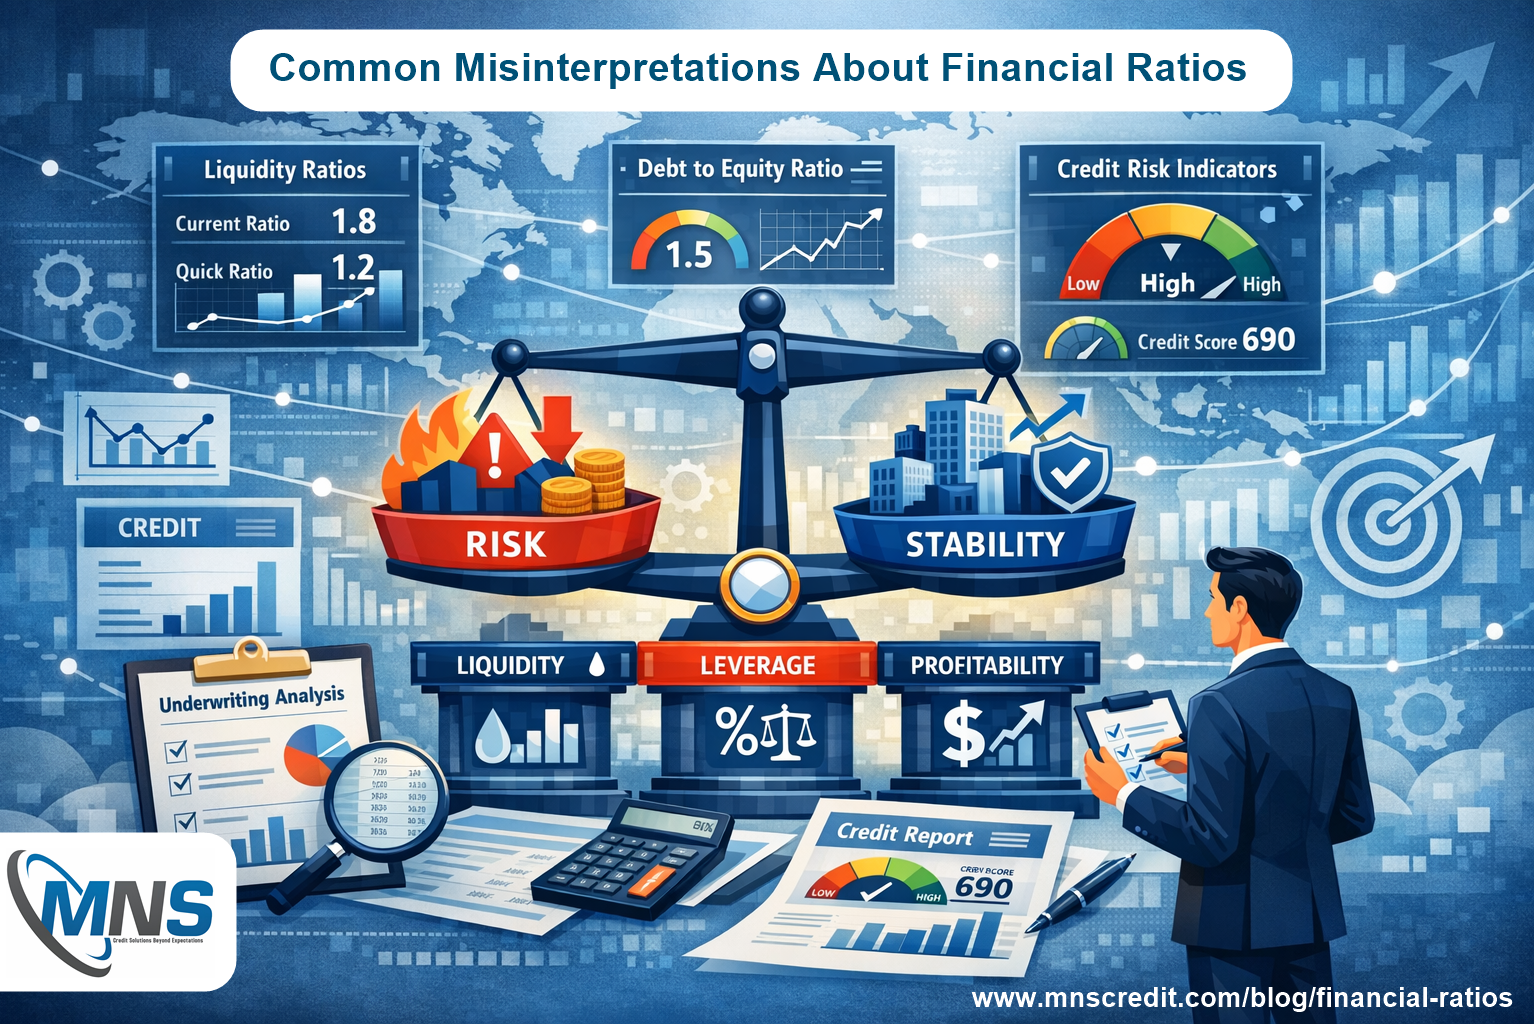
Financial Ratios are among the most powerful instruments in the analytical toolkit of investors, credit managers, and business owners. They condense complex financial data into comparable, interpretable metrics that support faster, more consistent decision-making. But like any powerful tool, they can cause significant damage when used incorrectly. Misinterpreted ratios lead to confident decisions grounded in flawed analysis — arguably more dangerous than acknowledging uncertainty and proceeding with caution.
The failure of Financial Ratios in practice is rarely a failure of the ratios themselves. It is almost always a failure of interpretation: a misunderstanding of what a ratio measures, a failure to account for context and industry norms, an over-reliance on a single metric, or a neglect of the qualitative dimensions that numbers alone cannot capture. Understanding these failure modes — and how to guard against them — is as important as knowing how to calculate the ratios in the first place.
Misinterpretation 1: Ignoring Industry Context
Perhaps the most widespread misinterpretation in ratio analysis is evaluating a ratio against a universal benchmark without accounting for industry-specific norms. A Debt-to-Equity Ratio of 3.0 would be alarming for a retail business but entirely normal — even conservative — for a real estate investment company or a utility operating with regulated revenue streams. A Current Ratio of 0.8 might signal distress in a manufacturing company but is perfectly functional for a supermarket chain with rapid inventory turnover and predictable daily cash receipts.
Every ratio should be evaluated against industry-specific benchmarks, not generic thresholds. The practice of comparing a company's Financial Ratios to those of its direct peers — rather than to abstract universal standards — is fundamental to avoiding this error. A Business Information Report that includes industry benchmarking data alongside the subject company's ratios provides this context efficiently and consistently.
Misinterpretation 2: Relying on a Single Ratio
Overconfidence in a single ratio is a recurring source of costly analytical errors. A company may have an impressive Return on Equity while simultaneously carrying dangerous levels of debt that the ROE figure flatters rather than reveals. A company may report a healthy Current Ratio while its Quick Ratio tells a very different story about the quality of its current assets. A company may show strong revenue growth that a top-line focused analyst celebrates while its deteriorating Net Profit Margin signals that the growth is destroying rather than creating value.
No single ratio tells the whole story of a company's financial health. Comprehensive ratio analysis requires assessing multiple metrics across liquidity, leverage, profitability, and efficiency — and interpreting them in combination. Divergences between different ratio categories are frequently more informative than any individual figure.
Misinterpretation 3: Treating Ratios as Current When They Are Historical
Financial Ratios are calculated from financial statements that are typically filed 6 to 18 months after the period they describe. A company whose most recently available accounts show a strong liquidity position may have experienced significant deterioration in the intervening period — deterioration that is entirely invisible in the historical ratio data. Treating ratios derived from aged financial statements as a reliable guide to current financial health is a structural error that even experienced analysts make.
Mitigating this limitation requires supplementing historical ratio analysis with more current indicators: recent payment behaviour data, updated MCA compliance records, management accounts where accessible, and qualitative intelligence about recent developments in the business or its market. Historical Financial Ratios establish the baseline; current data updates the picture.
Misinterpretation 4: Accepting Accounting Choices at Face Value
Financial statements — and therefore the ratios derived from them — reflect accounting choices that can vary significantly between companies and across time periods. The choice of depreciation method, inventory valuation approach, revenue recognition policy, and treatment of intangible assets all affect reported figures in ways that can make direct ratio comparisons between companies misleading even when they operate in the same industry.
When comparing Financial Ratios across companies, or when evaluating whether a sudden ratio improvement is genuine or accounting-driven, understanding the underlying accounting policies is essential. A dramatic improvement in Net Profit Margin that coincides with a change in depreciation policy warrants scepticism. A receivables balance that has grown faster than revenue may reflect genuine credit extension or potentially aggressive revenue recognition practices. Ratios reveal patterns; qualitative investigation explains them.
Misinterpretation 5: Confusing Correlation with Causation in Trend Analysis
Trend analysis — tracking ratios across multiple periods — is one of the most valuable applications of ratio analysis, but it carries its own interpretive risks. A consistently improving Current Ratio may reflect genuine liquidity strengthening — or it may reflect a build-up of slow-moving inventory or uncollected receivables that are inflating current assets without representing genuine financial health. A declining Asset Turnover Ratio may signal operational inefficiency — or it may reflect deliberate investment in new capacity that will generate superior returns in future periods.
Trend analysis identifies patterns; it does not explain them. Every significant trend observed in Financial Ratios should prompt the analyst to ask why — and the answer to that question requires engagement with the business's operational reality, not just its reported numbers.
Building Ratio Analysis That Is Robust to These Failures
Guarding against these common misinterpretations requires combining several good practices: always benchmarking against industry peers; always assessing multiple ratios across multiple categories; supplementing historical statements with current data wherever possible; understanding the accounting policies underlying the figures; and treating ratio analysis as the starting point for investigation, not the final word.
For analysts and credit managers working with external companies, a comprehensive Business Information Report that pre-calculates key Financial Ratios, presents them across multiple years, and benchmarks them against industry norms significantly reduces the risk of the most common errors by building context and comparison into the analytical foundation.
Conclusion
Financial Ratios do not fail — analysts fail the ratios by misinterpreting them. The difference between ratio analysis that generates genuine insight and ratio analysis that creates false confidence lies entirely in the quality of interpretation. Understanding the common failure modes — industry context blindness, single-ratio overreliance, historical data naivety, accounting policy neglect, and trend misattribution — and building analytical practices that guard against each of them is what separates competent ratio analysis from genuinely expert financial risk assessment.
- Digital Agency
- Literie
- Location de voitures
- Restaurant
- Restaurant
- Mode
- Mode
- Information
- Marketing
- Tourisme
- Développement
- Découverte
- Législation
- Gastronomie
- Pâtisserie
- Event
- Art
- Causes
- Crafts
- Dance
- Drinks
- Film
- Fitness
- Food
- Games
- Gardening
- Health
- Home
- Literature
- Music
- Networking
- Other
- Party
- Religion
- Shopping
- Sports
- Theater
- Wellness
 English
 Indian
 French
 Arabic
 Spanish
 Portuguese
 Deutsch
 Turkish
 Dutch
Dutch
 Italiano
 Russian
 Romaian
 Portuguese (Brazil)
 Greek
Greek